Geo Blog Post #10: My Birthstone: Rubies

Ruby 1

Ruby raw gemstones2

RUBIES

For this week’s blog post, I would like to discuss Rubies! Rubies are my birth stones—as they are the birthstone for the month of July… so I figure I will take this opportunity to broaden my knowledge of them.

To begin, the distinguishing characteristic of a ruby is its beautiful red color—interestingly, this color is an expression of the high levels of chromium (The Nature of Rubies). This mineral attributes its name to this color—“the word ruby comes from the Latin ‘rubens’ which means red” (Ruby Facts). Rubies are part of the corundum mineral species (The Nature of Rubies).

In terms of mineral hardness, rubies are very strong—roughly a 9 on the Mohs hardness scale; “[t]hey are as resilient as sapphires and only slightly softer than diamonds” (Ruby Facts).
Moreover, some rubies have the capability to fluoresce red in daylight. Fluorescence can be defined as an objects ability to “emit visible light when it is exposed to radiant energy” (The Nature of Rubies). Burmese rubies —which usually form in marble material– tend to have this characteristic ability. On the other hand, “Thai and Cambodian rubies, which form within basaltic, iron-rich rocks, do not fluoresce” (The Nature of Rubies).

Another characteristic/property of rubies that I found to be intriguing was that of “asterism.” Asterism refers to the “reflective ‘star’ patterns formed by tiny silk inclusions in some cabochon sapphires and rubies; a six rayed ‘star’ is most often displayed in rubies, but a twelve-ray star can occur and is highly prized” (The Nature of Rubies).

Given that it is a precious gemstone and that it can be very prized, my next question was… where (geographically speaking) are these beautiful mineral found? After some research I found my answer: they have been found “all over the world, including in Myanmar (formerly Burma), Africa, Australia and the USA” (Ruby Facts).

As I continued my research, I read something I still find hard to believe. Since almost all rubies contain flaws, it makes sense that those without any imperfections would be extremely rare. BUT!!!—brace yourselves— a ruby that has absolutely no imperfections can be priced higher than diamonds of similar weight and quality! I never thought my birthstone was so impressive. Again, I have respect for yet another mineral.

A few additional questions arose in my mind as I was reading: where is the largest ruby? How big is it? “The world’s largest ruby is owned by a Chinese jewelry company. It weighs 8184 g (40920 Carat) and measures 5.11 x 5.43 x 5.70 inches” (Ruby Facts).

And lastly…. just to reinforce the fact that rubies are the most impressive gemstone of all (no bias, of course): rubies are often associated with themes concerning the “essence and vibrancy of life; if there is one gemstone that represents the passion of love, it is the ruby” (Ruby Facts).

Works Cited

“The Nature of Rubies.” The Natural Sapphire Company. Web. 15 Apr. 2013. .
“Ruby Facts: Interesting Information about Rubies.” Israel Diamonds: Forever Brilliant. Web. .

Posted in Uncategorized | Leave a comment

Geology Blog #9: Seismic Waves and Building Design Principles

geoblog9_2

geoblog9

In Geology lab this week, we have begun constructing buildings that will (hopefully) withstand various types of seismic waves. Therefore, I would like to use this weeks blog post to review the various types of seismic waves and introduce a few design principles recommended by the National Institute of Building Sciences. (Hence, the A team will win this building competition) 🙂

First… the types of seismic waves!

“Regardless of the type of plate interaction that causes an earthquake, the result is the same. Vibrations from the release of energy as the rocks fail are sent out from the site of the earthquake to surrounding locations in the form of body and surface waves” (Shake, Rattle, and Roll Earthquake Board). Body waves are seismic waves that travel through the Earth interior; body waves travel much more quickly than surface waves and start at the earthquake focus. Surface waves start at the epicenter and move over the Earth’s surface.

These two main categories of waves are then farther divided into subcategories. Body waves are further divided into: P waves and S waves. Surface waves are subdivided into L waves and Rayleigh waves.

P waves (also known as Primary compressional waves) “are the first energy waves to arrive at a seismograph station once an earthquake occurs ( Shake, Rattle, and Roll Earthquake Board). These waves have the capability to travel through both solid and liquid layers of the Earth in a “push-pull, linear motion;” due to this type of motion, little displacement of Earth materials actually takes place (Shake, Rattle, and Roll Earthquake Board). These waves can travel more than 12,000 mph depending on the type of material they are traveling through.

S waves (also referred to as Secondary shear waves) are usually much more destructive than P waves; S waves move in an up- down motion. Interestingly, these waves only pass through solids— this characteristic limits which seismographs can register the earthquake occurrence. In regards to speed of travel, S waves reach a “maximum velocity of 3 km/second” (Shake, Rattle, and Roll Earthquake Board).

As previously mentioned, surface waves are subdivided into L waves and Rayleigh waves. L waves– or love waves– arrive after S waves and are “horizontal transverse waves that travel across the Earth” (Shake, Rattle, and Roll Earthquake Board). The motions of these waves are similar to that of a snake. Of the four types of waves caused by an earthquake, love waves are the most destructive. Lastly, Rayleigh waves. These waves travel in a “backwards elliptical motion” (Shake, Rattle, and Roll Earthquake Board).

Now…. the design principles to help us mitigate the effects of these waves.

Just to provide context as to why this topic is important…the statistics below are an excerpt from the National Institute of Building Sciences.

EXCERPT: “About half of the states and territories in the United States—more than 109 million people and 4.3 million businesses—and most of the other populous regions of the earth are exposed to risks from seismic hazards. In the U.S. alone, the average direct cost of earthquake damage is estimated at $1 billion/year while indirect business losses are estimated to exceed $2 billion/year.”

The website offered wonderful explanations of seismic design factors that must be taken into account such as: damping, ductility, strength, stiffness, and building configuration. Moreover, the website discussed a few strategies that the A team could take advantage of:

1) Moment-Resistant Frames: Column/beam joints in moment-resistant frames are designed to take both shear and bending. These frames look like triangles in the corners of walls. Our stucture will integrate this feature.

2) Base Isolation: “This seismic design strategy involves separating the building from the foundation and acts to absorb shock. As the ground moves, the building moves at a slower pace because the isolators dissipate a large part of the shock” (Seismic Design Principles). Due to the fact that we are using Popsicle sticks and toothpicks, this may be difficult to achieve… but we will nonetheless make an attempt!

Works Cited

“Shake, Rattle, and Roll Earthquake Board.” Lab Handout.

“Seismic Design Principles.” WBDG. National Institute of Building Sciences. Web. 06 Apr. 2013. .

Posted in Uncategorized | 1 Comment

Geo Blog #8: My favorite mineral (Galena) and rock (Obsidian)

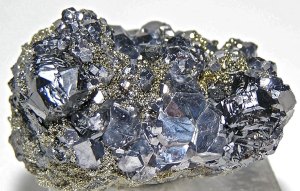
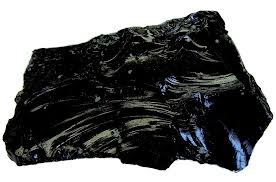
I have really enjoyed this Introduction to Geology course so far. Now, given the occasion to discuss minerals and rocks, I will be able to identify my favorite. In regards to the minerals, galena captured my interest the most. For the rock category, Obsidian was my favorite. I would like to use this blog post to explain some characteristics of each.

Galena

geoblog8pic2

Galena is the natural mineral form of lead sulfide (PbS). The main characteristic that allured me was that galena contains cubic crystals. This particular mineral is fairly common and occurs in numerous locations worldwide including England, Germany, Bulgaria, Romania, and Kosovo (a part of former Yugoslavia!—- no wonder I was attracted to this mineral!) (The Mineral Galena).

So apart form its beauty due to luster, how is this mineral used? Well, in ancient Egypt, galena was applied around the eyes to help both reduce the glare of the desert sun and repel flies. More currently, Galena serves as an important mineral because it serves as an ore for most of the world’s lead production. In addition, Galena is also a significant ore of silver (King). “The number one use of lead today is in the lead-acid batteries that are used to start automobiles” (King).

Now…. on to my favorite rock…… (I admit it… I fall for looks)…..

Obsidian

geoblog8pic1

Obsidian, an extrusive igneous rock, can be referred to as volcanic glass; its glassy appearance is the result of rapidly cooled volcanic lava. In other words, the lava cooled so rapidly that atoms are unable to arrange themselves into a crystalline structure. In regards to its color, Black is the most common color of obsidian; nonetheless, it can also be brown or green (Obsidian: Igneous Rock). As a “glass”, obsidian can be considered “chemically unstable.” This means that, “[w]ith the passage of time, some obsidian begins to crystallize” (Obsidian: Igneous Rock). This process of crystallization does not happen at a constant/uniform rate throughout the rock— instead, the process is much more random as the chemical change begins at various locations within the rock.

Geographically speaking—like Galena– obsidian is found in a wide variety of locations worldwide. It tends to be “confined to areas of geologically recent volcanic activity. Obsidian older than a few million years is rare because the glassy rock is rapidly destroyed or altered by weathering, heat or other processes” (Obsidian: Igneous Rock). In the United States, Obsidian can be found in Arizona, California, Idaho, Nevada, New Mexico, Oregon, Washington, and Wyoming (Obsidian: Igneous Rock).

Interestingly, due to fracturing patterns—-more specifically, conchoidal fracturing— obsidian can be used to create ultra-thin blades with tips that can be as narrow as 3 nanometers (Obsidian: Igneous Rock). Such thin blades can be useful for creating extremely precise incisions. This “easy to recognize” rock was one of the first targets of organized mining during the stone age; “it is probably a safe bet that all natural obsidian outcrops that are known today were discovered and utilized by ancient people” (Obsidian: Igneous Rock). While this material has been used since the stone age, it continues to play a very important role in modern surgery.

Works Cited:

“Obsidian: Igneous Rock.” Web. 31 Mar. 2013. .

“The Mineral Galena: Information and Pictures.” Web. 31 Mar. 2013. .

King, Hobart. “Galena: Mineral.” Web. 01 Apr. 2013. .

Posted in Uncategorized | Leave a comment

Geology Blog #7: Reflection on the Critical Thought Symposium: The Yellowstone Supervolcano

GEO PIC BLOG #7

This past Thursday (March 21st) I took part in the Critical Thought Symposium; the issue at hand was the Yellowstone Supervolcano. My assigned role was the “U.S. Geological Survey (USGS) Volcanologist and Yellowstone Volcano Observatory (YVO) Scientist- in- Charge (SIC).” I would like to use this blog as 1) a reflection on the experience and 2) a review of a few volcanic terms and concepts for our upcoming exam.

First, I would like to offer a bit of background to the symposium situation. Yellowstone is located in the northern Rocky Mountains in Wyoming, Montana, and Idaho (McNutt and Salazar 2010). “Yellowstone National Park, justly famous for its unmatched geysers, diverse wildlife, and uniquely preserved ecologic communities, also encompasses one of Earth’s largest systems of volcanic, seismic, and hydrothermal activity” (Christiansen et al. 2010: 4).

In class we discussed various types of volcanoes. The Yellowstone system is a caldera. The Yellowstone caldera makes up roughly one third the area of Yellowstone National Park (McNutt and Salazar 2010). Three immense explosions have occurred over the past 2.1 million years; these powerful volcanic eruptions covered large portions of North America with ash and debris (Pillar). “Regional tectonics and the magmatic system combine to produce some of the highest levels of earthquake activity in the conterminous U.S. outside of California” (Christiansen et al. 2007: 8).

The caldera itself is underlain by two types of subsurface magma: basaltic magma and rhyolitic magma. As discussed in class, these two types of magma vary in their compositional nature, which in turn affects how it behaves during an eruption. Basaltic magma is relatively fluid and has very low resistance to flow; as a result, it is generally associated with small to moderate volumes of magma and relatively brief eruptions. On the other hand, rhyolitic magma is more viscous and can either “erupt effusively to produce small to large volumes of lava or explosively to produce course pumice and finer ash” (Christiansen et al. 2007: 1).

I– as the YVO SIC— was responsible for analyzing periodic updates of volcanic activity form the USGS and deciding weather to increase the volcano alert level as well as the aviation color code . The four periodic updates that I received addressed a plethora of volcanic ‘vital signs’ including deformation patterns, earthquake swarms and intensities, gas release data, and hydrothermal explosions. Seismic data, deformation data, and hydrothermal data, all contribute to helping identify any impending volcanic eruptive activity. However, given that “[n]o volcanic eruption has occurred in Yellowstone National Park or vicinity in the last 70,000 years,” it becomes very difficult to identify a threshold an impending volcanic eruption (Christiansen et al. 2007: 3). “One obstacle to accurate forecasting of large volcanic events is humanities lack of familiarity with the signals leading up to the largest class of volcanic eruptions” (Lowenstern et al. 2006).

This caveat in the data analysis proved to be very inconvenient during the symposium as policy makers and response teams continually demanded precise answers that I could not generate due to the nature of the issue at hand.

Likewise, many demanded estimates of impact ranges which are just as difficult to generate. Depending on the magnitude and nature of the hazardous geologic event, as well as the time and season when it might occur, roughly 70,000 to 100,000 people could be affected (Christiansen et al. 2007: 1). “The most violent event could affect a broader region of even continent-wide areas” (Christiansen et al. 2007: 1).

Overall, I think the symposium went went really well; it successfully simulated how difficult it is to analyze volcanic data and forecast behaviors for decision-making that will effect large numbers of the public.

Works Cited

Christiansen, Robert L., J. Lowenstern, R. B. Smith, H. Heasler, L. A. Morgan, M. Nathenson, L.G. Mastin, L.J.P. Muffler, J.E. Robinson. (2007). Preliminary Assesment of Volcanic and Hydrothermal Hazards in Yellowstone National Park and Vicinity. United States Geological Survey (USGS).

McNutt, Marcia K., and Salazar, K. (2010). Protocols for Geologic Hazards Response by the Yellowstone Volcano Observatory. United States Geological Survey (USGS).

Pillar, Greg. Queens University of Charlotte. February 14th, 2013.

Lowenstern, J. B., Smith, R. B., & Hill, D. P. (2006). Monitoring super-volcanoes: geophysical and geochemical signals at Yellowstone and other large caldera systems. Philosophical Transactions of the Royal Society A: Mathematical, Physical and Engineering Sciences, 364(1845), 2055-2072.

Posted in Uncategorized | Leave a comment

“Sinkholes: an act of Geology, not God”

3fcc29a80d5d0aa99d054b9018967207

aad127568dcc81e4ebe40c26caf646a4

sinkhole-13

sinkhole-14

As I was brainstorming a topic for this blog post, I came across the picture above. The image is that of a giant sinkhole that destroyed several homes in Guatemala City in 2007. The scale of the image in the sinkhole was simply breathtaking—and it encouraged me to explore the topic further. At first, the image of these sinkholes almost looks unreal; they really attest to the power of water via erosion.

Sinkholes are underground caverns—of various sizes—that are carved out by water or heavy rains which are naturally acidic. They can be found all over the world; however, they are most common in places where the ground is made of soft rocks like gypsum, limestone, or salt beds. These rocks are easily dissolved (soluble rock), thus creating giant caverns. This type of ground can also be referred to as “Karst Terrain.” After a bit of research, I learned that –according to the USGS–roughly 20 percent of the world’s surface comprised of karst topographies. Just about every state contains at least some Karst Terrain; Florida, for instance is almost completely underlain by limestone. Nevertheless, this process of erosion takes place over long periods of time—100s, 1000s, 10,000s of years.

There are two main ‘methods’ by which sinkholes form. The first option is a divot forming in the ground as a result of the gradual erosion of the earth beneath it. The second— more catastrophic— option involves a lag time between the erosion process and the collapse of the top group layer; this lag time results in the top layer remaining intact while a huge cavern is carved out underneath. These are the sinkholes that initially caught my eye —- they seem so unrealistic!

There are also other types of sinkholes in addition to Karst sinkholes. For instance, man induced sinkholes in urban areas due to the presence of pipelines, water mains, and sewer lines – which are basically manmade caves underground. As the aging infrastructure deteriorates, there is a heightened potential for collapse.

The USGS is mapping the geology of areas in order to determine where the soluble rocks are on the surface and sub-surface in order to help assess risk for sink holes.

At a first glance, this kind of risk assessment did not seem very vital—however, I stand much corrected as these incidents are much more common than I initially thought. In Tampa, Florida, a man was killed as a sinkhole overcame his home. The gaping hole was 9 meters across and 15 meters deep! Similarly, a 150-metre by 50-metre sinkhole in Ningxiang, China destroyed at least 20 houses in June 2010—fortunately, no one was killed in this incident. Another incident occurred at a subway construction site in central Guangzhou, China. Interestingly, a “2008 report by the Guangdong Geology Institute found the surrounding area was not geologically stable, though plans for two subway lines passing through the area still proceeded” (Sinkholes: An Act of Geology”).

For more interesting information about sinkholes, see the articles below 🙂

Sources Consulted

“Sinkholes: An Act of Geology, Not God.” South China Morning Post.Web. 12 Mar. 2013. .

“What Causes A Sinkhole.” Business Insider. Web. 12 Mar. 2013. .

Posted in Uncategorized | 1 Comment

Geology Blog # 5: The Mystery of Stonehenge… and the application of Geology to unravel it!

N061044

geoblog5pic2

Given that we have started our unit on rocks…it got me thinking large-scale: Stonehenge.
Stonehenge is a prehistoric monument in the English county of Wiltshire. According to Britannia History, Stonehenge is a national icon that symbolized “mystery, power and endurance.” Of the many mysteries surrounding Stonehenge, its original intended purpose is one of them. Researchers have “speculated that it was a temple made for the worship of ancient earth deities. It has been called an astronomical observatory for marking significant events on the prehistoric calendar. Others claim that it was a sacred site for the burial of high-ranking citizens from the societies of long ago” (Britannia History). Another unanswered question surrounding this monument is that of who built Stonehenge. Some theories attribute the creation of the monument to people of the late Neolithic period (around 3000 BC), while others cite the Druids (Britannia History).

Stonehenge is made up of an inner ring and an outer ring. The inner ring is made up of small blue stones; the stones of the inner ring of Stonehenge are made of dolerite, which is a dark,medium-grained igneous rock. The dolerite rocks of Stonehenge “weigh up to 4 tons each, and about 80 stones were used [in total]” (Britannia History). Given the immense size of these blue stones, I found it astonishing that they are believed to from the Prescelly Mountains, located roughly 240 miles away. There are extensive theories on how these immense stone traveled so far without sophisticated tools and technologies.

The outer ring of this impressive engineering feat is comprised of sarsen stones, which are sandstone blocks found in abundance on the Salisbury Plain (Britannia History). These sarsen stones weigh as much as 50 tons each (Briannia History). These 50 ton sandstone blocks are believed to have come from 20 miles away!

A relatively recent BBC article (December 2011) mentioned that scientists have claimed for the first time that they can pinpoint the “precise origin of some of the rocks at Stonehenge” (BBC). Interestingly, a keeper of geology at the National Museum of Wales and a professor at Leicester University have been working together for nine months to collect and identify rock samples from “rock outcrops in Pembrokeshire to try to find the origins of rhyolite debitage rocks that can be found at Stonehenge” (BBC).

For a little background information, rhyolite is a pale fine-grained volcanic rock. In other words, it is an igneous felsic rock; it is a relatively common volcanic rock and has the same chemical equivalent as granite (Rhyolite).

The two geological researchers undertook the task of detailing the mineral content and texture of rocks; this process is also known as petrography (BBC). Amazingly, “they found that 99% of the samples could be matched to rocks found in this particular set of outcrops” (BBC). The scientists mentioned that identifying the source of the rocks is the first step in addressing the question (or better said, mystery) of transport.

Reading about the recent findings regarding Stonehenge has really enlightened me to the powers of Geological research; they mystery of Stonehenge is slowly being unraveled.

Work Cited:

“Stonehenge Rocks- Pembrokeshire Link Confirmed.” BBC News. 19 Dec. 2011. Web. 23 Feb. 2013. .

“Stonehenge.” Britannia History. Web. 23 Feb. 2013. .

“The Rock.” Rhyolite. Web. 23 Feb. 2013. .

Posted in Uncategorized | 1 Comment

Geo Blog # 4: The Yellowstone Supervolcano

Yellowstone

L12-YellowstoneSign

Last week, I was briefed for our next Critical Thought Symposium; the topic of the next symposia is the Yellowstone supervolcano. The magnitude potential of Yellowstone immediately grabbed my attention. I was assigned the role of the ‘Yellowstone Volcano Observatory Scientist –in-Charge’. Interestingly during my research, I stumbled upon an article written by Jake Lowenstern, the current scientist-in-charge for the Yellowstone Volcano Observatory based at the U.S. Geological Survey (USGS) in Menlo Park, California. Therefore, I would like to use this blog post as a reflection on that article.

First…let’s begin with some background information. The Yellowstone supervolcano is a caldera, a violent type of volcano that is a combination of mafic and felsic material. According to the U.S. Geological Survey, a supervolcano implies “an eruption of magnitude 8 on the Volcano Explosivity Index, meaning that more than 1,000 cubic kilometers (250 cubic miles) of magma are erupted” (Lowenstern).

The Yellowstone volcanic field is one of the most seismically active areas of the western U.S., experiencing … more than 30,000 earthquakes from 1973 to 2007” (Farrell). The Yellowstone Volcano Observatory (YVO) was founded in 2001 by a joined effort between the U.S. Geological Survey (USGS), Yellowstone National Park, and the University of Utah. These parties work in unison to ensure that “there is a proper response to any geologic even that occurs at Yellowstone” (Dr. Pillar).

In his article titled, “Truth, Fiction and Everything in between at Yellowstone,” Lowenstern discusses his views on the myths surrounding Yellowstone. While Lowenstern acknowledges that Yellowstone will most likely erupt again, he doubts that the magnitude of the eruption will amount to the three largest explosive eruptions, 2.1 million, 1.3 million and 640,000 years ago (Lowenstern). Lowenstern continues on to discuss how “docudramas,” news articles, and the Internet have instilled unrealistic conceptions of the Yellowstone volcano. Instead of portraying the effects of a small eruption, these sources become chronicle a near-future cataclysm as they assume the worst possible scenario; for instance, BBC Science and National Geographic have contributed to false public impression. Lawenstern describes this as “creatively embellishing the fundamental science.”

Lowenstern concludes his article by reflecting on the ‘public face of science.’ He mentions that one of the challenges he faced once being promoted to ‘scientist-in-charge of the Yellowstone Volcano Observatory’ was communicating technical information to a public. Nonetheless, he acknowledges how vital the skill is. “When the science is ignored, or misunderstood, everyone loses. The challenge for us scientists is to relay both the details and the context of our work, so that society understands that science is ultimately a human endeavor — sometimes uncertain, often complex, but always exciting” (Lowenstren).

It was that excitement that prompted me to conduct further research on the potential effects of super-volcanic eruptions from peer-reviewed sources. I came across an interesting source addressing the atmospheric impacts of such a large-scale eruption. The article discussed a plethora of impacts that create a sort of chain reaction on the atmosphere. One of the many impacts discussed by Harris is that of sulfuric acid droplets. “The most widespread global effects of a large volcanic eruption are not caused by ash or pyroclastic flows, which can be locally devastating, but by tiny droplets of sulfuric acid, known as sulphate aerosol, which decrease the amount of solar radiation reaching the surface and lead to a cooling” (Harris).
I will continue to explore this topic in the coming weeks as I form my research paper.

Work Cited:

Farrell, J., Husen, S., & Smith, R. B. (2009). Earthquake swarm and b-value characterization of the Yellowstone volcano-tectonic system. Journal of Volcanology and Geothermal Research, 188(1), 260-276.

Harris, B. (2008). The potential impact of super‐volcanic eruptions on the Earth’s atmosphere. Weather, 63(8), 221-225.

Lowenstern, Jake. (June 2005). “Truth, Fiction and Everything in between at Yellowstone.” Geotimes. Web. 17 Feb. 2013. .

Posted in Uncategorized | 1 Comment

Geo Blog #3: The International Quest for Minerals

geoblog3pic1

Given that our Mineral Identification Exam is slowly approaching, I thought I would continue my exploration of minerals. Given the plethora of uses for minerals that were discussed in blog post #2, it does not come as a surprise that nations are in a constant search for new sources of these materials. In this particular blog post, I will review a few recent news articles from around the world regarding mineral mining and acquisition.

One article, titled “Rare Earth Minerals found in abundance in Jamaican Mud,” was published by a British popular news site. The article mentions that Jamaica’s red mud contains “high concentrations of rare-earth elements.” This new finding brings joy to the country as it means other countries are willing to invest in buildings and equipment for a pilot project to see if cost-effective extraction is a possibility. For instance, a Japanese firm by the name of “Nippon Light Metal” is willing to invest $3 million, with the hope of extracting 1,500 tones of rare earth oxides annually (Steadman).

Jamaica’s economic turmoil has contributed to sluggish growth and a high unemployment rate of 12.7 percent; “[r]are earth mineral extraction could prove a big boost the nation’s economy” (Steadman). However, what is beneficial to the economy may not be so in regards to the environment. Interestingly, executive director of the Jamaica Bauxite Institute has stated that “unlike many other countries where rare earth minerals are mined with severe negative impacts on the environment … the Jamaican scenario is completely different” (Dunkley-Willis). The Dunkley-Willis article details Japans unique approach to the process of extraction (see citation below for more of the technical information—it is quite interesting to read).

The rare earth minerals each contain one or several different elements—many of which are vital in the electronics industry worldwide. This drive to search for new sources is in part due to China’s role in the World Trade Organization. China joined the WTO in 2001; as a result of high production rates, prices dropped significantly, causing many mines around the world out of business. Currently however, due to “a combination of dwindling [Chinese] reserves and geopolitical paranoia,” the quest for new sources is reborn again.
For instance, Japan and Vietnam have launched a joint effort to further research rare earth mineral extraction. Moreover, in 2012, “a team from the University of Tokyo claims to have found 6.2 million tonnes of rare earth minerals in the Pacific seabed” (Steadman).

The second news article is titled, “Alaska to Commence Mining of Rare Earth Minerals by 2016.” This article thematically follows the previous one very well in that it discusses the hopes of an Alaskan company to in order to help combat China’s domination of the international rare earth market. “Alternative sources of rare earth minerals are in strong demand amongst OECD economies, due to their vital role in a swathe of hi-tech industries as well as China’s semi-monopoly on supply” (Mining.com).

Works Cited:

Steadman, Ian. “Rare Earth Minerals Found in Abundance in Jamaican Mud.” Wired UK. Web. 08 Feb. 2013. .

Dunkley-Willis, Alicia. “JBI Head Says Extraction of Rare Earth Minerals Won’t Be Harmful.” Jamaica Observer News. Web. 08 Feb. 2013. .

“Alaska to Commence Mining of Rare Earth Minerals by 2016.” Mining.com. Web. 08 Feb. 2013. .

Posted in Uncategorized | Leave a comment

Geology Blog Post #2: Minerals—Properties and Uses

minerals

Given that we are currently studying minerals (Chapter 3), I thought it would be interesting to look into some of the practical uses of various minerals. The process of identifying minerals via color, luster, and hardness, was thrilling earlier this week; however, knowing real-world applications of mineral material would give me a sense of context and perspective. Therefore, this week, I decided to blog about common mineral uses and the properties that make them suited for a particular purpose.

I would like to begin with my favorite mineral that the class identified in lab: Galena. The chemical formula of Galena is PbS (lead sulfide). The United States is the leading producer, consumer, and re-cycler of lead. Galena is used in batteries, gasoline additives, construction, ammunition, and even cathode ray tubes for monitors.

Graphite was my second favorite mineral that we identified as a class. Like Galena, Graphite has a a metallic luster. While I knew that it was used in pencils, I learned that Graphite is also used as a lubricant for locks and machinery. Given its slippery feel, it is very suited for this purpose.

Moreover, using the mohs hardness scale during lab, I learned that talc is listed as the softest mineral. Talc is primarily utilized in the production of paper. However, it is also used in a wide array of other household goods including baby powder, deodorant, and makeup.

Another mineral that is widely used is Calcite, which has a chemical formula of CaCO3. Calcite is “the principal constituent of limestone and marble” (Geology.com). I found it eye catching that Calcite is used as a soil additive. Due to its alkaline properties, Calcite has the capability to neutralize acidic soils. For instance, Calcite is applied in places that are effected by acid mine drainage; crushed limestone is dispensed into the streams to neutralize the waters. This mineral can also be considered a carbon repository; “[t]he process of limestone formation removes carbon dioxide from the atmosphere and stores it away for long periods of time” (Geology.com). Therefore, Calcite serves a distinct role in ecological nutrient cycling.

Halite, or salt, serves a wide variety of purposes: from seasoning and food preservation, to lowering the freezing point of water in order to keep ice off roads.

Lastly, I am going to discuss Quartz, which has a chemical formula of SiO2 (Silica dioxide). Quartz has the ability to generate electricity when under mechanical stress; this property is known as piezoelectricity. As a result, quartz is used for pressure gauges, oscillators, resonators, and wave stabilizers. Additionally, given its high hardness, Quartz is commonly used in glass production.

Throughout my research, I stumbled upon the USGS ‘minerals yearbook’; this ‘yearbook’ is an impressive record of minerals, their properties, the markets in which they are primarily used, and–sometimes– even their history in regards to industrial usage rates etc. It is really interesting to look through if you are interested in the creative applications of minerals; I highly recommend it!

Needless to say, I have definitely gained a new appreciation for minerals after reading all about their various uses.

Thank you for reading!

Works Cited/ Consulted:

“Uses for Minerals.” Northwest Mining Association. Web. 02 Feb. 2013. .

“Talc and Pyrophyllite Statistics and Information.” USGS Minerals Infromation: Talc and Pyrophyllite. Web. 03 Feb. 2013. .

Calcite. Geology.com: News and Information about Geology. Web. 03 Feb. 2013. .

“Minerals and Their Uses.” ScienceViews.com. Web. 03 Feb. 2013.

Posted in Uncategorized | 2 Comments

Geology Post #1: San Andreas Fault, California

geoblogpost1pic1

1

In class this past week, we kept mentioning the San Andreas Fault in California. Due to its size (roughly 810 miles) and position near city centers, it grabbed my attention. It is located where the Pacific and North American tectonic plates meet. Interestingly, the San Andreas Fault accounts for as much as “35 mm/yr of the 53 mm/yr of local relative motion between the Pacific and North America plates” (Loveless and Meade). Historically speaking, this motion was expressed through the Wrighthood 7.5 earthquake and the Fort Tejon 7.9 earthquake (Loveless and Meade). Interestingly, when observing the spacial distribution of the earthquakes along the San Andreas Fault, they are not evenly spread. Instead, earthquake eruption patterns have displayed a higher density near the Big Bend portion of the fault.

I read an article written by the Geological Society of America (GSA) titled “Stress Modulation on the San Andreas Fault by Inter-Seismic Fault System Interactions.” The article discusses how significant the concept of interconnectedness between separate tectonic plates is. For instance, during the time in between large earthquakes– called the “inter-seismic phase of the earthquake cycle”– stress accumulates on fault lines as a result of plate motions. Authors Loveless and Meade emphasize the fact that earthquake cycle processes can prompt non-local stress changes; in other words, the activities at one particular fault location can influence that of another.

Via computer models, the authors show that the total inter-seismic strain resulting from fault interactions within South California may directly impact specific portions of the San Andreas Fault line (within the Big Bend region, specifically) by an estimated 38%. This accumulation of non-local stress can have huge implications for the Los Angeles metropolitan areas near the San Andreas fault, as the stress accumulation– based on models and assumptions of steady fault system behavior– was about 3 times that of changes induced by recent South California earthquakes. Therefore, the gradual effect of non-local interaction cannot be ignored; they can potentially account for a higher impact earthquake. The article explains that the total stress on a fault results from a plethora of factors including: “the cumulative effects of coseismic, postseismic, and interseismic earthquake cycle
processes” (Loveless and Meade).

Moreover, the article mentions that the population of Los Angeles has grown from fewer than 10,000 to more that 10 million over the past years, calling them the “seismically exposed population” given that earthquake cycle processes continually modulate on the San Andreas Fault line.
Overall, I found this article interesting to read in that it explained the multitude of factors involved in stress accumulation at fault lines; it is not as simple as an analysis of 2 plates interacting. The non-local effect are critical to take into account.

Additionally, I thought I would seek out a popular article to compliment the GSA one. An article– titled “California’s San Andreas Fault could rupture, cause mega-quake,study says” — by ABC local news in Los Angeles, CA, made a comparison between the the potential of the San Andreas Fault and the 9.0 magnitude earthquake that hit Japan in 2011. The popular news article draws parallels between the “creeping segments” of the San Andreas Fault and the similar structure of the fault in Japan. Researchers long believed that the San Andreas Fault was slipping “slowly and steadily, releasing pressure as tectonic plates shifted.” However, according to studies on one particular portion of the fault, the article claims that many now believe the fault has “the potential to behave like locked segments, which build up stress over time and then rupture.”

There is undoubtedly and uncomfortable tension surrounding the San Andreas Fault line— both literally and geologically.

Posted in Uncategorized | 2 Comments